


ROAS for Ticket Sales: Formula, Break-Even and Why Platform ROAS Misleads
How to calculate ROAS, find your break-even ROAS and tell it apart from ROI, with a worked example. Plus why Meta, Google and TikTok overstate ROAS for tickets, and how to calculate a real ROAS from incremental tickets and net revenue in your ticketing system.


ROAS is simple to calculate: divide the revenue a campaign generated by what you spent on that campaign. If €2,000 of ad spend brings in €10,000 of ticket revenue, your ROAS is 5, or 500%. The hard part is not the division. It is deciding which revenue the ads actually caused.
And that is exactly where ROAS becomes misleading in ticketing. Meta, Google and TikTok all claim the same ticket purchases at the same time, count fans who were going to buy anyway, and report gross order values including fees. This guide gives you the formula, the break-even ROAS, the difference between ROAS and ROI, and a method to calculate an honest ROAS from your ticketing system.
Key takeaways
- ROAS is revenue from ads divided by ad spend: €10,000 of ticket revenue from €2,000 of spend is a ROAS of 5, or 500%.
- Compare it with break-even ROAS (1 ÷ contribution margin), calculated per show from your own deal terms and on the same revenue basis.
- Platform ROAS runs high: attribution windows, view-through and modeled conversions, and several platforms claiming the same ticket all push it up.
- Calculate real ROAS as incremental net revenue from your ticketing system divided by ad spend across all channels, using a documented baseline.
- In the worked example, a blended platform ROAS of 7.0 becomes a real ROAS of 2.8, just above the net break-even of 2.5.
What is ROAS and how to calculate it
What ROAS means
ROAS stands for return on ad spend: revenue per unit of currency spent on advertising. It is an efficiency metric for media, not a profit metric. ROAS tells you how much revenue gets attributed to a campaign. It does not tell you whether you made money.
The ROAS formula
ROAS = revenue from ads ÷ ad spend
You can express the result as a ratio (5.0, or 5:1) or as a percentage (500%). Both mean the same thing. What matters is that revenue and spend cover the same period and the same campaign. Spend always includes media. Whether you add creative production and tools is your call, but decide once and stick to it so shows stay comparable.
Example: a concert in a 2,500-capacity venue
- Meta Ads budget during presale and general on-sale: €6,000
- Ticket purchases Meta attributes to the campaign: 720 tickets
- Average order value per ticket reported by the pixel: €55
- Reported revenue: 720 × €55 = €39,600
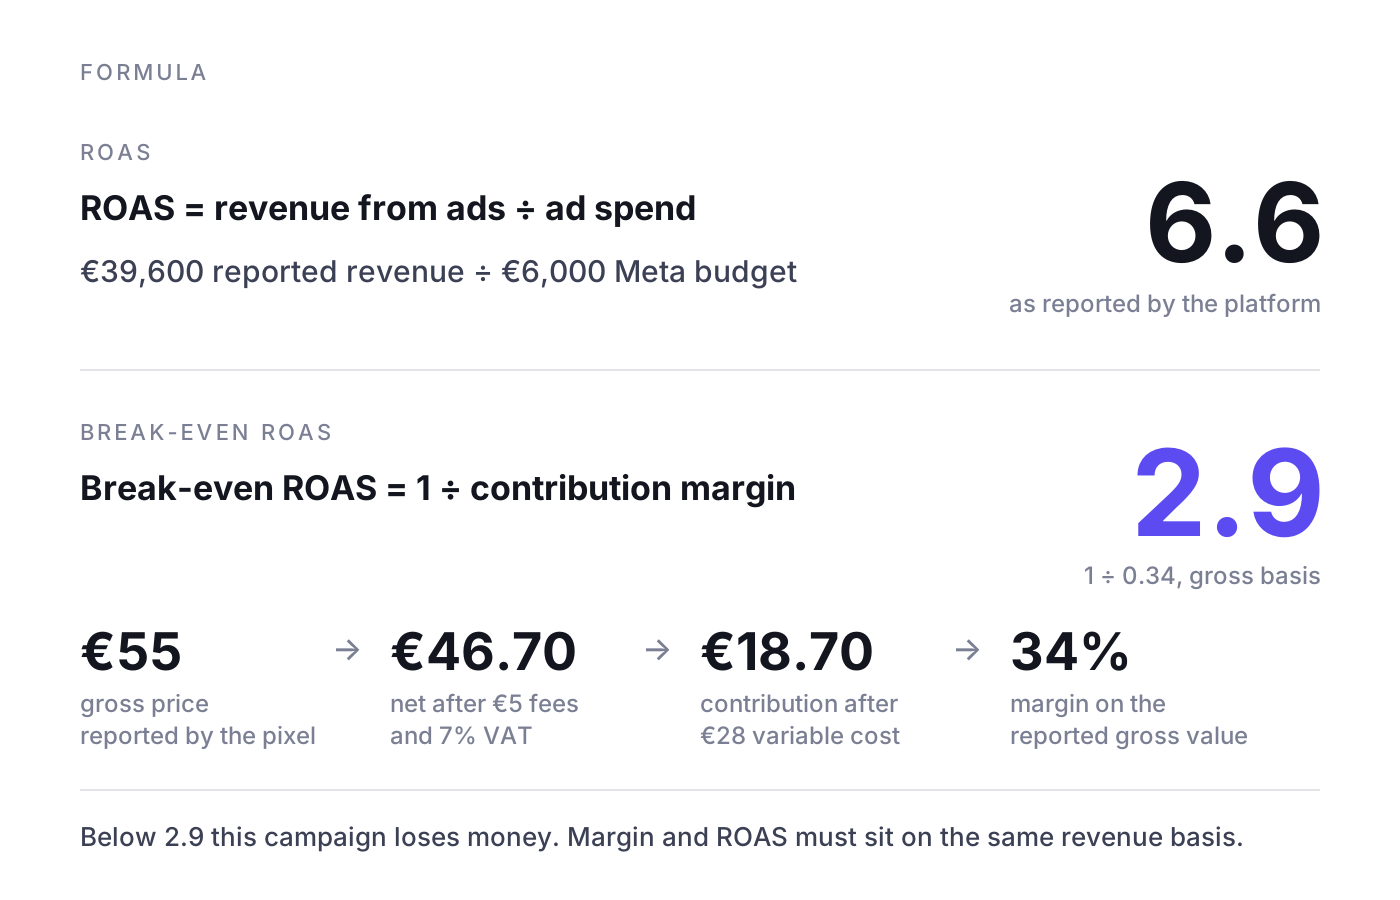
ROAS = €39,600 ÷ €6,000 = 6.6. For every euro spent, the platform reports €6.60 in revenue. Looks excellent. We will put it to the test below, using the same numbers.
Break-even ROAS: the number that actually matters
A ROAS figure means little until you compare it with your margin. Break-even ROAS is the point at which a campaign exactly covers its cost: no profit, no loss.
Break-even ROAS = 1 ÷ contribution margin
Contribution margin is the share of revenue left over after all the variable costs of selling one more ticket. In live entertainment that typically means VAT or sales tax, booking and service fees that do not stay with you, revenue-based artist shares, revenue-based royalties or performing rights fees, and payment processing. Fixed costs such as venue hire, production or the artist guarantee do not belong in this calculation, because you pay them whether or not the ads sell one extra ticket.
Example: break-even ROAS for the show above
- Gross ticket price as reported by the pixel: €55 (including €5 in fees that go to the ticketing company)
- Net revenue after fees and VAT (7% in this example): €50 ÷ 1.07 = about €46.70
- Variable cost per additional ticket (artist share, royalties, payment fees): €28
- Contribution per ticket: €46.70 minus €28 = €18.70
- Margin on the reported gross value: €18.70 ÷ €55 = 34%
- Break-even ROAS on a gross basis: 1 ÷ 0.34 = 2.9
Below 2.9 this campaign loses money. Above it, it makes money. Make sure margin and ROAS are on the same revenue basis. If the platform reports gross values including fees and tax, your margin must be calculated on gross too. Calculate margin on net and ROAS on gross, and you set your break-even too low and keep funding campaigns that lose money.
Deal structure moves break-even fast: at a 20% margin on gross, break-even ROAS is 5 (1 ÷ 0.2). At 50%, it is 2. So calculate it per show from your own deal terms, not once as a blanket number for everything.
What is a good ROAS?
The honest answer: there is no universal benchmark. A ROAS of 3 can be highly profitable for an in-house production with low variable costs and a loss-maker for a tour date with a large artist share. Anyone who quotes you an industry number as a target does not know your margin.
A good ROAS is one that sits reliably above your break-even ROAS, measured on real, incremental revenue. Three things help you judge it:
- Build in a buffer: set your target above break-even, because platform numbers tend to run high rather than low. The ticketing reconciliation below tells you how big that buffer needs to be.
- Account for the phase: during announce and on-sale, demand is high and ROAS looks good almost by default. In the long middle of the sales cycle it drops. That is not a campaign failure, it is the demand curve.
- Use marginal ROAS, not the average: an average ROAS of 6 can hide the fact that the last €2,000 only returned 1.5. Budget decisions depend on what the next euro brings in. More on this in marginal cost per incremental ticket.
A very high ROAS is not automatically good either. It can mean you are mostly reaching people who would have bought anyway, and that more budget aimed at new audiences would sell more additional tickets.
ROAS vs ROI
ROAS and ROI are often used interchangeably. They measure different things.
- ROAS = revenue ÷ ad spend. A revenue metric for the ad channel.
- ROI = (contribution minus investment) ÷ investment. A profit metric that includes costs and margin.
Using the numbers above: €6,000 in ads, €39,600 in reported gross revenue, 34% margin. Contribution is €39,600 × 0.34 = €13,464. ROI = (€13,464 minus €6,000) ÷ €6,000 = 124%. A ROAS of 6.6 and an ROI of 124% describe the same campaign, but only ROI tells you whether money is left over. And both rest on reported revenue, which, as you are about to see, is too high.
To judge the economics of a whole event, including fixed costs and every channel, see the guide to event ROI.
Where platform ROAS comes from, and why it misleads for tickets
The ROAS you see in Meta Ads, Google Ads or TikTok is not a measurement in the strict sense. It is an allocation, made under each platform's own rules. Four mechanisms push it up.
1. Attribution windows
By default, Meta credits a purchase to an ad if it happens within 7 days of a click or 1 day of a view. Google can use even longer click windows depending on your settings. The longer the window, the more purchases fall inside it that would have happened without the ad.
2. View-through conversions
A fan scrolls past your ad without really noticing it, then buys the next day from a link in your newsletter. With 1-day view attribution, Meta counts that purchase as an ad result. For shows with a large existing fan base, a substantial share of reported revenue can come from this alone.
3. Modeled conversions
Where tracking is missing (no consent, iOS restrictions, blocked cookies), platforms fill the gap with estimated conversions. That is methodologically defensible, but it is still an estimate made by the party that makes money from your budget. A clean Meta Conversions API setup improves the data, but it does not remove the other effects.
4. Every platform claims the same purchase
A buyer sees a TikTok video, clicks a Meta ad two days later, and searches the artist's name on Google that evening. All three platforms report the same ticket. Add up platform revenue and you quickly end up with more than your ticketing system actually sold. How to deal with that is covered in marketing attribution for live events.
What makes it worse in ticketing
- Fans who would have bought anyway: for known acts, a large share of tickets sells through the announcement, the mailing list, artist channels and word of mouth. Retargeting those same people produces high ROAS and very few additional tickets.
- Presales: fan club, artist and partner presales reach your most loyal buyers. If ads run during that window, they claim purchases that would have come through the presale codes regardless.
- Gross vs net revenue: the pixel usually passes the order value including booking, facility and service fees plus tax. Far less of that stays with you.
- Refunds and comps: the platform sees the purchase, not the later refund, the exchange or the guest list allocation.
- Demand spikes: on-sale day, an extra-date announcement or a viral moment for the artist drives purchases that every campaign inside the window credits to itself.
How to calculate a real ROAS from your ticketing system
The reliable approach: calculate ROAS not from platform data but from tickets sold in your ticketing system, and only from the portion that advertising added.
Real ROAS = incremental net revenue ÷ ad spend across all channels
- Set the period: the same window for ticket sales and ad spend, ideally week by week.
- Pull sales from the ticketing system: sold, non-refunded tickets, excluding comps, guest list and partner allocations.
- Estimate a baseline: how many tickets would you have sold without paid media? Useful anchors are the sales pace before the campaign started, comparable shows with little budget, regions with no ads (geo holdout) and planned pauses. The methods are explained in detail in incrementality testing for ticket sales.
- Calculate incremental tickets: actual tickets minus baseline.
- Apply net revenue: incremental tickets × net revenue per ticket, excluding fees that do not stay with you and excluding tax.
- Add up all ad spend: Meta, Google, TikTok and any other paid channels, each with the same cost definition.
- Compare with break-even on a net basis: 1 ÷ (contribution ÷ net revenue per ticket).
Example: the same show, calculated honestly
Same show, now with every channel included.
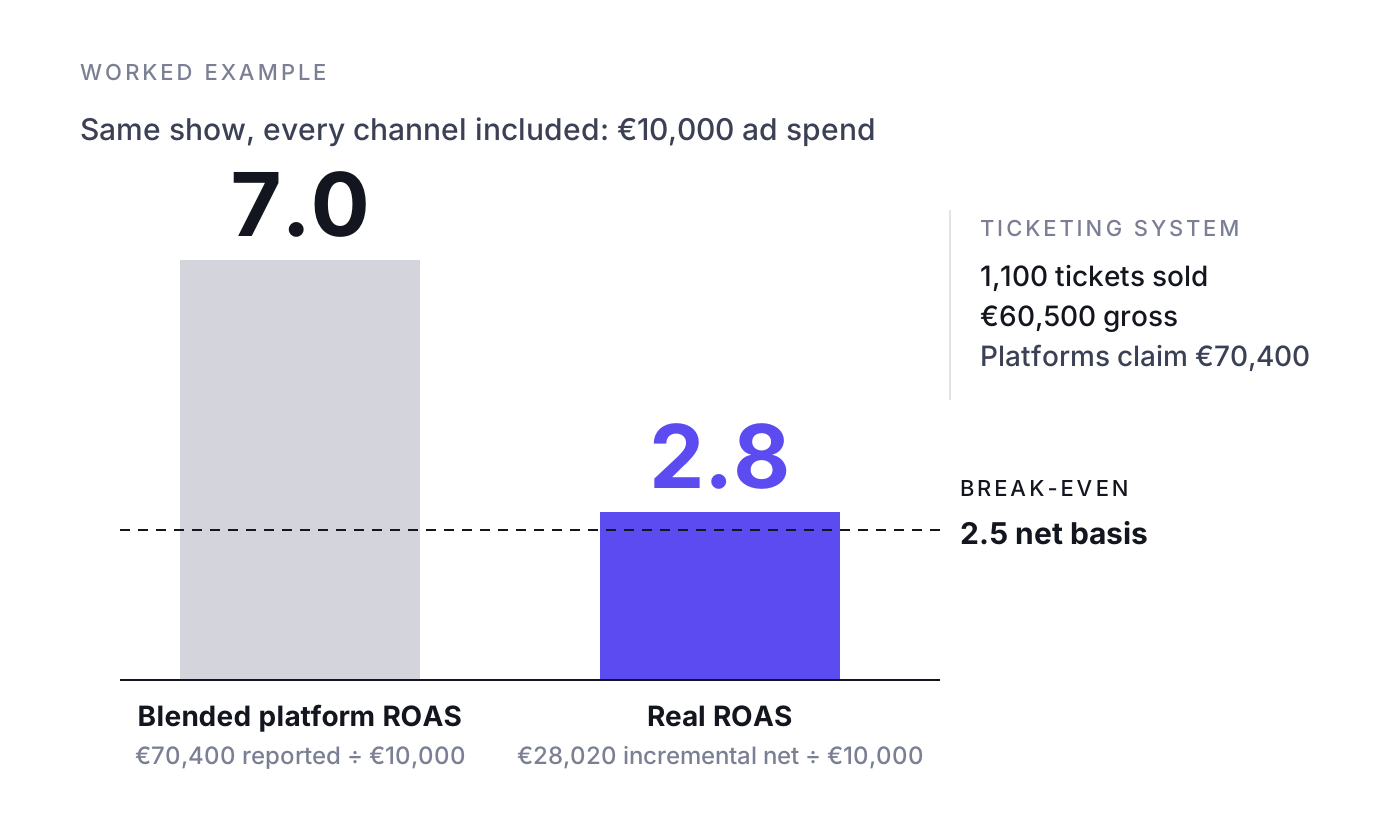
- Ad spend: Meta €6,000, Google €2,500, TikTok €1,500, total €10,000
- Reported revenue: Meta €39,600, Google €22,000, TikTok €8,800, total €70,400 (blended platform ROAS 7.0)
- Ticketing system for the same period: 1,100 tickets sold, €60,500 gross. The platforms claim more revenue than was sold in total.
- Baseline from pre-campaign sales pace and comparable shows: 500 tickets
- Incremental tickets: 1,100 minus 500 = 600
- Incremental net revenue: 600 × €46.70 = €28,020
- Real ROAS: €28,020 ÷ €10,000 = 2.8
Break-even on a net basis is 2.5 (€18.70 contribution ÷ €46.70 net revenue = 40% margin, 1 ÷ 0.4 = 2.5). So the campaign is marginally profitable: 600 × €18.70 = €11,220 in contribution against €10,000 of spend, a little over €1,200 profit. A platform ROAS of 7.0 has become a real ROAS of 2.8. Based on the first number, you would double the budget. Based on the second, you would first check which channel and which phase actually delivered the additional tickets.
The baseline is an estimate and never perfect. An honest, documented estimate still beats a precise-looking platform number that runs consistently high. Apply the same method to every show.
Using platform ROAS the right way
Platform numbers are not useless. Within one platform they work well for comparing ads, audiences and creatives against each other. They do not work for splitting budget across channels or judging whether a show's marketing paid off. A practical approach is a correction factor per channel (real ROAS ÷ platform ROAS), derived from tests and reviewed regularly. For the other numbers worth tracking alongside it, see ticket sales analytics and KPIs.
Checklist: calculating ROAS for ticket sales
- Break-even ROAS calculated per show from your own deal terms, separately for gross and net basis
- Revenue basis confirmed: does the pixel pass gross values including fees and tax, or net?
- Attribution window documented for every platform, view-through conversions reported separately
- Platform revenue added up and reconciled against the ticketing system
- Refunds, comps and allocations removed from ticketing revenue
- Baseline estimated per show, with the method written down
- Presale periods and on-sale spikes analyzed separately
- Real ROAS calculated weekly from incremental net revenue
- Budget decisions based on marginal ROAS, not the average
- At least one incrementality test per season, such as a geo holdout or a planned pause
Where NYBA fits
NYBA is the Revenue OS for live entertainment. NYBA OS forecasts ticket demand per show, runs campaigns on every channel that sells tickets (Meta, Google, TikTok and other paid channels), shifts budget toward the shows that need it, and measures everything against verified ticket sales from the ticketing system, not platform-reported purchases. The calculation in this article (incremental tickets against a baseline, net revenue against spend) stops being a spreadsheet exercise and runs continuously for every show.
It is built on 75M+ tickets, 1,200+ events per year and 100+ promoters, including Live Nation, Cirque du Soleil and BBC Earth. NYBA's specialists work as the expert layer on top of the platform.
Frequently asked questions
How do you calculate ROAS?
Divide revenue from ads by ad spend. Example: €15,000 in revenue on €3,000 of spend is a ROAS of 5, or 500%. For tickets, use incremental net revenue from your ticketing system as the revenue figure, not the platform number.
What is a good ROAS for concerts and events?
There is no universal number. A good ROAS sits reliably above your break-even ROAS, which depends on your margin per additional ticket. With a large artist share, even a ROAS of 4 can be too low. For an in-house production, 2 may be enough.
How do you calculate break-even ROAS?
Break-even ROAS = 1 ÷ contribution margin. Example: if 25 cents of every euro of ticket revenue remains after variable costs, break-even ROAS is 1 ÷ 0.25 = 4. Margin and ROAS must use the same revenue basis, gross or net.
Is ROAS the same as ROI?
No. ROAS compares revenue with ad spend. ROI compares profit with the investment. Depending on your margin, a ROAS of 3 can mean a positive or a negative ROI.
Why does Meta show a higher ROAS than my ticketing system supports?
Because Meta credits purchases inside its attribution windows, counts view-through conversions, models missing data and reports gross values including fees. Google and TikTok often claim the same purchases on top of that, so the sum across platforms can exceed your actual ticket revenue.
If you want to see what your ROAS looks like measured against verified ticket sales, book a demo. One event, clean numbers, then you decide.
Related reading: Marketing attribution for live events, Incrementality testing for ticket sales, Facebook Ads KPIs, How to sell more tickets

Was würde 3x mehr
Umsatz für dich bedeuten?
Finde es heraus:
