


Event ROI: How to Measure It, With Metrics, KPIs and a Worked Example
Most event ROI numbers use gross revenue and credit marketing with every ticket. Learn the formula based on net ticket revenue and incremental tickets, the costs to include, the KPIs that matter, and a fully worked example for a 2,000-capacity show.


Event ROI sounds simple: what you got back, divided by what you put in. In practice, most event ROI numbers that land in a post-show report are wrong in the same two ways. They use gross ticket revenue instead of the money the promoter actually keeps, and they credit marketing with every ticket sold, including the ones that would have sold anyway.
This guide shows you how to calculate event ROI so the number survives a conversation with your finance lead: the formula, which revenue and cost lines belong in it, the difference between the ROI of the event and the ROI of the marketing spend, a fully worked example for a 2,000-capacity show, the KPIs worth tracking and the ones to ignore.
Key takeaways
- Event ROI is (return minus investment) divided by investment, but calculate total event ROI and the ROI of the marketing spend separately.
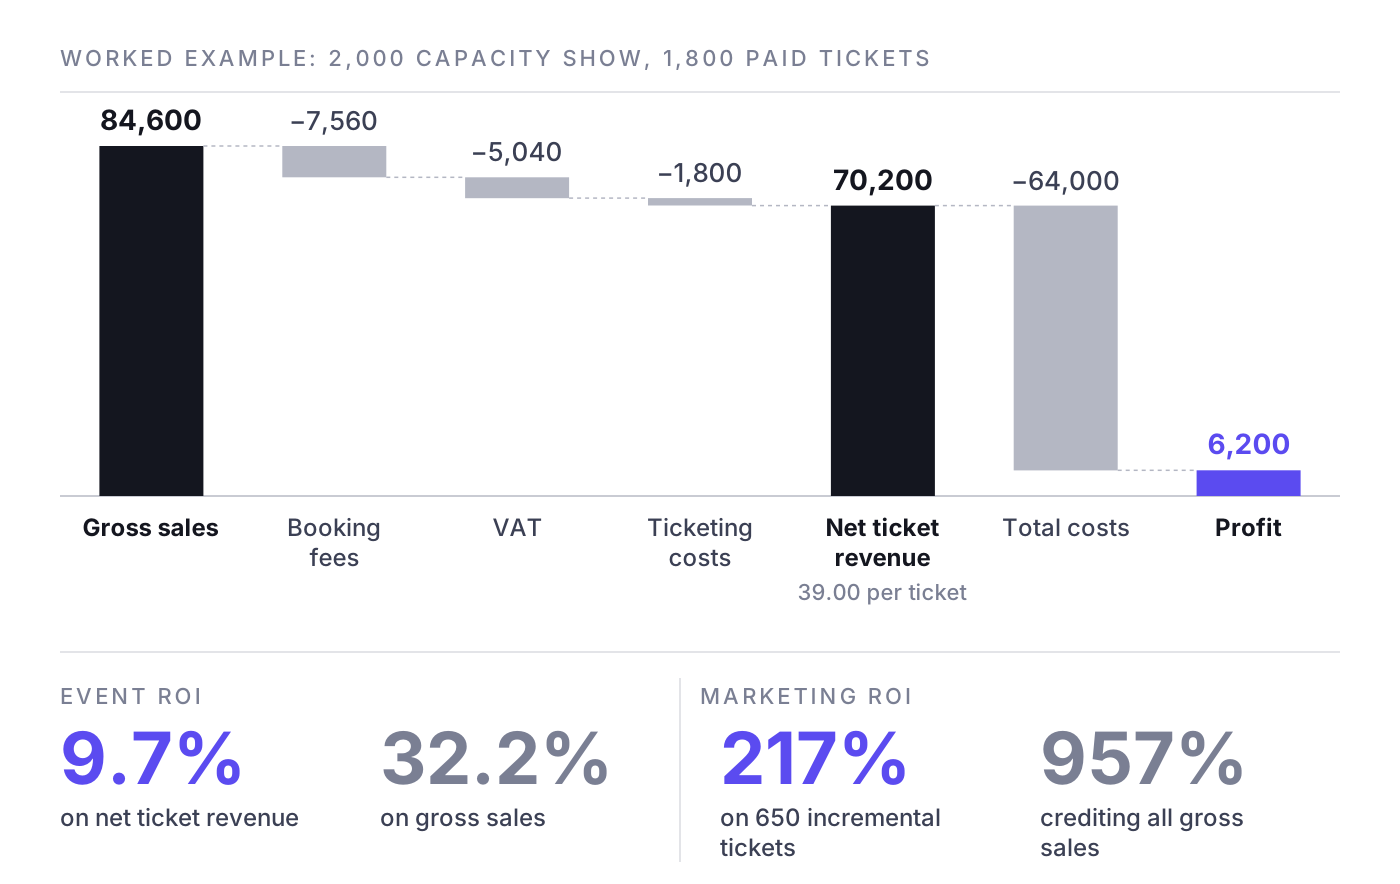
- Use net ticket revenue (gross minus booking fees, VAT, ticketing costs and refunds); in the worked example, gross revenue suggests an event ROI of 32.2%, net revenue gives 9.7%.
- Credit marketing only with incremental tickets (total paid tickets minus baseline), valued at the contribution margin per ticket.
- Include every cost line, and count creative production and tools in the marketing investment, not just media spend.
- Lock in the deal model, baseline method, ticketing data feed and cost ledger before the on-sale, and calculate per date rather than averaging across a run.
The basic event ROI formula
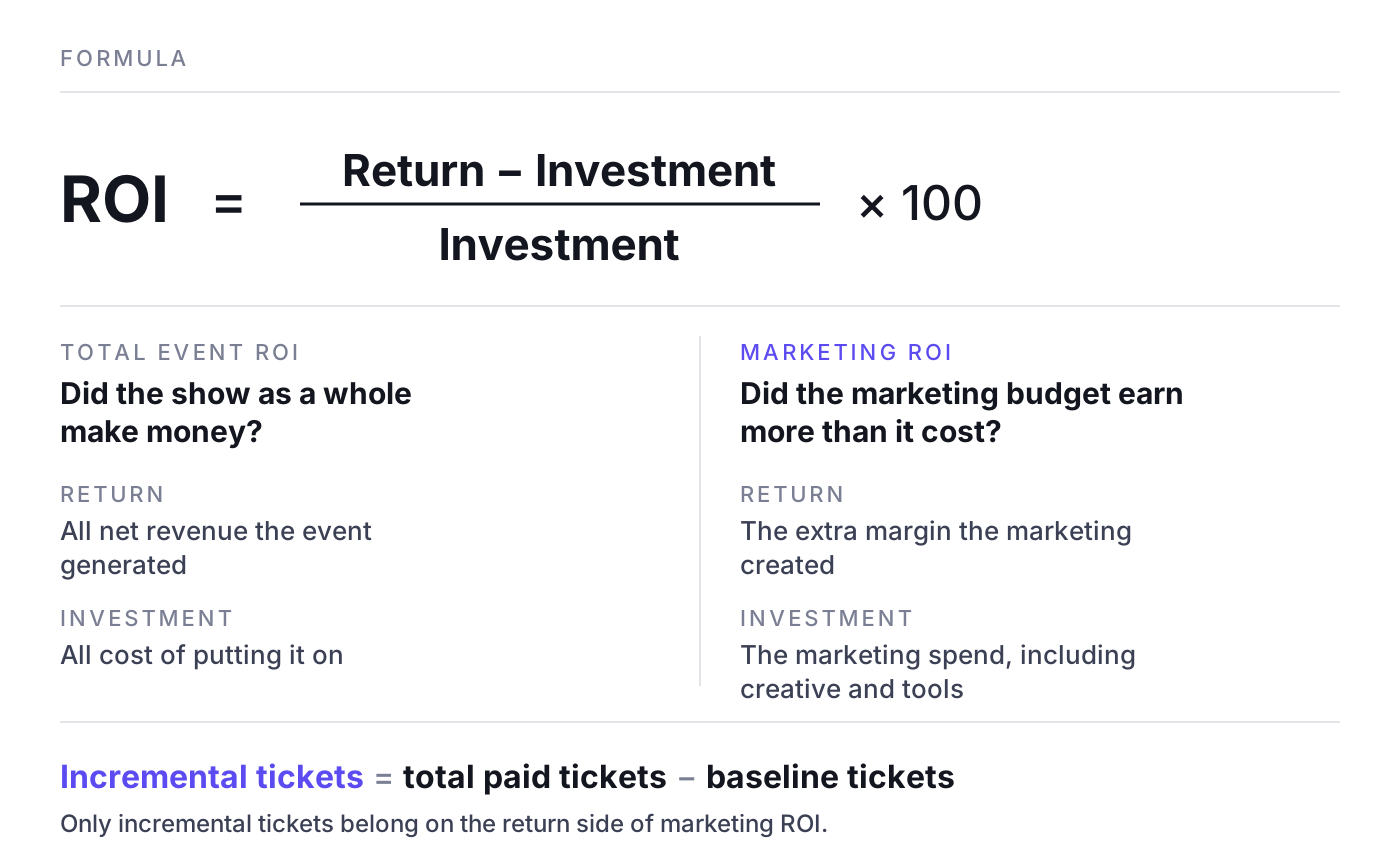
ROI = (Return minus Investment) / Investment × 100
An ROI of 25% means every 1.00 spent came back as 1.25. The formula never changes. What changes, and what decides whether the number means anything, is how you define "return" and "investment".
For ticketed live entertainment there are two different questions hiding behind "event ROI", and you need a separate calculation for each:
- Total event ROI: did the show as a whole make money? Return is all net revenue the event generated, investment is the full cost of putting it on.
- Marketing ROI: did the marketing budget earn more than it cost? Return is the extra margin the marketing created, investment is the marketing spend.
Mixing the two is the most common reason a show can report "10x return on ads" and still lose money.
Total event ROI vs ROI of the marketing spend
Total event ROI answers the investor question: was this show worth doing? It is driven mainly by the deal, pricing and capacity.
Marketing ROI answers the operator question: should we have spent more, less or differently on promotion? Here the investment is only the marketing spend, and the return is only the margin the marketing actually caused. That leads to the most important correction in this whole article.
Incremental tickets vs all tickets
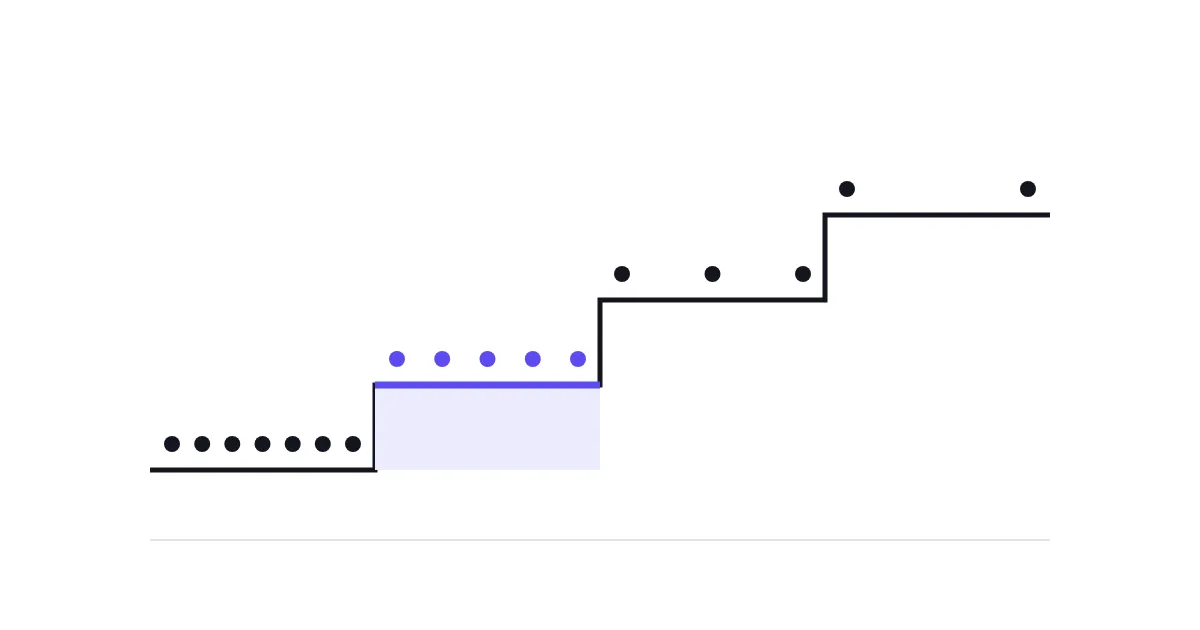
Not every ticket sold during a campaign was sold by the campaign. Fans on the artist's mailing list, presale buyers in the first minutes after the announce, buyers from the venue's own channels: many would have bought without a single paid ad. These are baseline sales.
Incremental tickets = total paid tickets minus baseline tickets.
Only incremental tickets belong in the return side of marketing ROI. You can estimate the baseline from comparable shows (same artist, similar market, similar on-sale timing), from the sales pace before paid media started, or, best of all, from a controlled test with holdout regions. The incrementality testing guide walks through how to set one up for a tour.
The same logic explains why the purchases reported by Meta, Google and TikTok cannot simply be added up. Each platform claims the tickets its users touched, and several platforms often claim the same buyer. More on that in marketing attribution for live events.
Why revenue-based ROI misleads for ticketed events
The number on your ticketing dashboard is usually gross: what the buyer paid at checkout. A large part of that never reaches the promoter. Strip it down to net ticket revenue first.
From gross to net ticket revenue
- Start with gross sales as shown in the ticketing system (paid tickets only, no comps).
- Remove booking and service fees that the ticketing company keeps. If your deal includes a rebate on fees, add only your share back.
- Remove VAT or sales tax. You collect it on behalf of the tax authorities; you do not earn it.
- Remove ticketing costs charged to you: inside fees, per-ticket charges, payment processing, chargebacks.
- Remove refunds and cancelled orders.
What is left is net ticket revenue. Add any other net income the event generated (your share of bar, merchandise commission, sponsorship cash) if you are calculating total event ROI.
From revenue to contribution margin
For marketing decisions, go one step further. An extra ticket is only worth its contribution margin: net revenue per ticket minus the costs that rise with each additional ticket. With a flat artist guarantee and flat venue hire, almost all of the net ticket price is contribution. With a versus deal, a door split or performing rights fees calculated on box office, a share of every extra ticket goes to someone else, and your contribution per ticket is lower. That is what one more sale is worth to you.
Cost categories to include
Total event ROI is only as honest as the cost side. Use this checklist so nothing slips through:
- Talent: artist guarantee, backend or bonus, support acts, riders, travel, accommodation, withholding tax where applicable.
- Venue: hire or rental, house staff, stewards, cleaning, venue settlement charges.
- Production: sound, light, backline, staging, crew, trucking.
- Compliance and risk: insurance, licences, performing rights fees, security, medical.
- Ticketing: fees charged to you, payment costs, access control hardware.
- Marketing: paid media on every channel, creative production, print and out of home, PR, influencer fees, tools and tracking setup.
- Overhead allocation: a fair share of internal staff time, if you want a fully loaded number. Be consistent: either always include it or never include it.
For marketing ROI, the investment is the marketing block only. Include creative production and tools, not just media spend.
Worked example: how to calculate event ROI for a 2,000-capacity show
Example only. All figures are invented to illustrate the method and are not benchmarks.
A promoter books a 2,000-capacity show. The buyer pays 47.00 per ticket at checkout: a face price of 42.80 including 7% VAT, plus a 4.20 booking fee kept by the ticketing company. The ticketing system also charges the promoter 1.00 per ticket. 1,800 tickets are sold, plus 100 comps.
Step 1: net ticket revenue
- Gross sales on the dashboard: 1,800 × 47.00 = 84,600
- Minus booking fees: 1,800 × 4.20 = 7,560
- Minus VAT: 1,800 × 2.80 = 5,040
- Minus ticketing costs charged to the promoter: 1,800 × 1.00 = 1,800
- Net ticket revenue: 70,200 (39.00 per ticket)
Step 2: total costs
- Artist guarantee (flat, no backend): 30,000
- Venue hire and staff: 12,000
- Production: 8,000
- Security and insurance: 3,500
- Performing rights and licences (flat in this example): 2,500
- Marketing (paid media 6,000, creative 1,500, tools 500): 8,000
- Total costs: 64,000
Step 3: total event ROI
Profit = 70,200 minus 64,000 = 6,200. Event ROI = 6,200 / 64,000 = 9.7%.
Had the promoter used gross sales from the dashboard, the result would have been (84,600 minus 64,000) / 64,000 = 32.2%. Same show, more than three times the ROI, none of it in the bank.
Step 4: marketing ROI on incremental tickets
Comparable shows and the sales pace before paid media started suggest a baseline of 1,150 tickets that would have sold without the campaign.
- Incremental tickets: 1,800 minus 1,150 = 650
- Contribution per incremental ticket: 39.00 (all other costs are fixed in this example)
- Incremental contribution: 650 × 39.00 = 25,350
- Marketing ROI = (25,350 minus 8,000) / 8,000 = 217%
- Cost per incremental ticket: 8,000 / 650 = 12.31
Cross-check: without marketing, the show would have sold 1,150 tickets × 39.00 = 44,850 against 56,000 of non-marketing costs, a loss of 11,150. With marketing it made 6,200. The difference, 17,350, is exactly the incremental contribution minus the marketing spend.
Step 5: test the baseline
Now suppose the baseline was actually 1,550. Incremental tickets drop to 250, incremental contribution to 9,750, and marketing ROI to 22%. Same spend, same sales, a completely different verdict. This is why the baseline deserves more attention than any other input, and why you should define how you estimate it before the campaign starts.
The naive version, crediting all 84,600 of gross sales to 8,000 of marketing, would have reported a 957% ROI. And that is the number most likely to end up in a deck.
Event ROI metrics and KPIs that matter
ROI is a verdict after the fact. These KPIs tell you during the campaign whether you are heading for a good one.
- Cost per incremental ticket: marketing spend divided by incremental tickets. Compare it with your contribution per ticket: as long as it is lower, more spend still pays. Watch the marginal version too, because the last thousand spent usually buys far fewer tickets than the first. See marginal cost per incremental ticket.
- Sell-through by tier: sold versus available per price tier and section. A show at 80% overall can be sold out in cheap tiers and stuck in premium ones, which is a pricing problem, not a media problem.
- Velocity vs comparables: tickets per day at the same number of days before the show, compared with similar past shows.
- Net revenue per ticket: net ticket revenue divided by paid tickets. It falls when discounts, cheap tiers or fee absorption creep in, even when ticket counts look healthy.
- Marketing cost share: marketing spend as a share of net ticket revenue (11.4% in the example above). Track it per show and per date to spot where budget is out of proportion to the revenue at stake.
Vanity metrics to ignore (as success measures)
- Impressions, reach and video views
- Clicks and click-through rate on their own
- Platform-reported purchases and platform ROAS, summed across channels
- Landing page sessions and add-to-cart counts that never reconcile with the ticketing system
They are diagnostics for creative and targeting, not results. If a metric cannot be traced back to a verified ticket in your ticketing system, it does not belong in an ROI calculation. The companion article on ROAS for ticket sales covers how to read platform numbers without being misled by them.
How to measure event ROI: set it up before the on-sale
You cannot reconstruct a clean event ROI after the show. Settle the following before the first ticket is sold:
- Write the deal into the model. Fee structure, venue terms, ticketing fees and VAT rate, so net revenue and contribution per ticket are known on day one.
- Lock in the baseline method. Pick the comparable shows, or plan a holdout (regions or audiences that get no paid media), or define a clean window before paid media starts. Write it down so nobody moves the goalposts later.
- Connect ticketing data. You need order-level exports with timestamp, tier, price paid, fees and postcode, ideally daily. A ticketing-first data layer makes this routine instead of a spreadsheet project.
- Standardise tracking. Consistent UTM parameters, pixel and server-side events on the checkout, and one naming convention across channels.
- Keep a cost ledger. Every marketing cost, including creative and tools, logged per show and per date, not per campaign name.
- Set decision rules. For example: "If cost per incremental ticket exceeds half the contribution per ticket for seven days, cut spend on that date."
- Agree the reporting cadence. Weekly during the on-sale, plus a final settlement view once refunds and fee rebates are in.
A short note on corporate and sponsored events
For a conference, product launch or client event without meaningful ticket revenue, the return side is not tickets. It is pipeline (qualified meetings, opportunities created, deals influenced), retention of existing clients, or brand outcomes such as measured awareness or consideration among the target audience. The formula still works, but you need an agreed value per outcome before the event. For sponsored events, the sponsor's ROI depends on the audience delivered and the activation results, so collect attendance, dwell time and lead data in a form the sponsor can verify.
Common event marketing ROI mistakes
- Using gross revenue. Booking fees and VAT are not yours. Start from net.
- Crediting marketing with every ticket. Without a baseline, marketing ROI is mostly a measure of how popular the artist already was.
- Adding up platform-reported purchases. Three platforms claiming the same buyer do not make three tickets.
- Leaving out creative and tools. Media spend is not the full marketing investment.
- Averaging across a multi-date run. A strong Saturday hides a loss-making Tuesday. Calculate per date.
- Counting comps as sales or forgetting refunds and chargebacks.
- Measuring only at the end. By then the budget is spent. Use the KPIs above to steer while you can still change the outcome.
Where NYBA fits
The hardest inputs in this article are the baseline and the verified ticket count. NYBA OS forecasts ticket demand per show, which gives you a baseline to measure against, runs campaigns on every paid channel that sells tickets, shifts budget towards the shows that need it, and measures everything against verified ticket sales from the ticketing system instead of platform-reported purchases. NYBA works across 1,200+ events per year for 100+ promoters, including Live Nation, Cirque du Soleil and BBC Earth.
Frequently asked questions
What is a good event ROI?
There is no universal benchmark. Total event ROI depends heavily on the deal and the risk you carry. For marketing ROI, the practical test is whether cost per incremental ticket stays below contribution per ticket. Any positive marketing ROI on incremental tickets means the spend paid for itself.
How do I calculate event ROI if I only know gross ticket sales?
Ask for the settlement or a detailed ticketing export. You need booking fees, VAT, ticketing charges and refunds to reach net ticket revenue. Calculating ROI on gross sales overstates the result, sometimes by a factor of three or more.
How do I estimate baseline ticket sales?
Use comparable past shows at the same point before the show date, the sales pace before paid media began, or a holdout test. A holdout is the most reliable method, comparables the most practical.
Is ROAS the same as event ROI?
No. ROAS divides revenue by ad spend and usually uses gross, platform-reported revenue. Event ROI uses net revenue or contribution margin, subtracts the investment and, for marketing ROI, counts only incremental tickets.
Should I calculate event ROI per show or per tour?
Both. The tour number tells you whether the project worked. The per-show and per-date numbers tell you where to move budget, which dates need help and which would have sold anyway.
The method above works with a spreadsheet. If you want it running automatically per show and per date, book a demo. One event, clean numbers, then you decide.
Related reading: Event marketing guide, Ticket sales analytics and KPIs, Demand forecasting for live events, Mid-week dates in multi-date runs

Was würde 3x mehr
Umsatz für dich bedeuten?
Finde es heraus:
