


Event Revenue Forecasting: How to Plan Ticket Revenue Realistically, With a Worked Example
Capacity times average price is not a revenue forecast. Learn how to build a ticket revenue forecast bottom-up from net prices, with three scenarios, a break-even point, weekly updates from the on-sale curve and a fully worked example.


A revenue forecast answers one simple question: how much money will actually come in over a given period? For promoters it sits underneath almost every decision, from the offer you make to an artist's agent to the marketing budget to whether a second date makes sense. Yet many show budgets still contain a single line: capacity times average ticket price, multiplied by an optimistic percentage.
Below you'll find the general method first, then event revenue forecasting in depth: a ticket revenue forecast built bottom-up from net prices, three scenarios, break-even, weekly updates against the on-sale curve, a fully worked example and a template for Excel or Google Sheets.
Key takeaways
- Build an event revenue forecast bottom-up: sellable capacity times expected sell-through per price tier times net price per ticket.
- Net price is the gross price minus VAT or sales tax, ticketing costs and fees; in the example, net revenue is about €11,600 below gross.
- Plan three scenarios (conservative, base, optimistic) and check whether the show still reaches break-even in the conservative case.
- Update the forecast every week by projecting actual sales against the on-sale curve of comparable shows.
- Keep ancillary revenue such as F&B or merchandise on a separate line and leave it out of the break-even calculation.
What is a revenue forecast? The three common methods
A revenue forecast is a reasoned estimate of income for a defined period or project. Reasoned means every number traces back to an assumption you can check and later compare against reality. A good forecast is a small model of assumptions, not a single number.
When you build a revenue forecast, you usually rely on one of three methods, or a combination of them:
- Top-down: you start from the total market and estimate your share of it. Example: a city has a certain number of musical theatre visits per year, and you assume you will capture a given share. Fast but rough, and better suited to business plans.
- Bottom-up: you build revenue from its smallest units, meaning quantity times price per product, channel or category. More work, but every assumption is visible and testable.
- Comparables and historical data: you look at how similar products, periods or projects performed and apply the pattern. This works well as long as your comparisons really are comparable.
For ticketed events, bottom-up is the right foundation, supported by comparable shows that you use to calibrate your assumptions and to check them continuously during the on-sale.
Why event revenue forecasting is different
An online store can sell without limit, all year. An event cannot. Four things make the forecast different:
- Fixed capacity: revenue has a hard ceiling. More demand than seats does not create more revenue, only the option of higher prices or an extra date.
- Price tiers: a venue is not one product. Front rows sell differently from the balcony, and the average price shifts depending on which tiers sell out first.
- Time-bound sales: every ticket has to be sold before doors. An unsold seat is gone for good on the night. That is why the shape of the on-sale matters as much as the final number.
- Fees and VAT: the price on the ticket is not what reaches the promoter. VAT or sales tax, ticketing costs, payment fees and refunds come off before the money is yours to plan with.
On top of that, a show rarely stands alone. On tours or multi-date runs in one city, dates affect each other. The forecast therefore belongs at the level of the individual date, not the tour average. How to estimate demand per date weeks before the on-sale is covered in our article on demand forecasting for live events.
How to build a ticket revenue forecast bottom-up, in four steps
The core formula is:
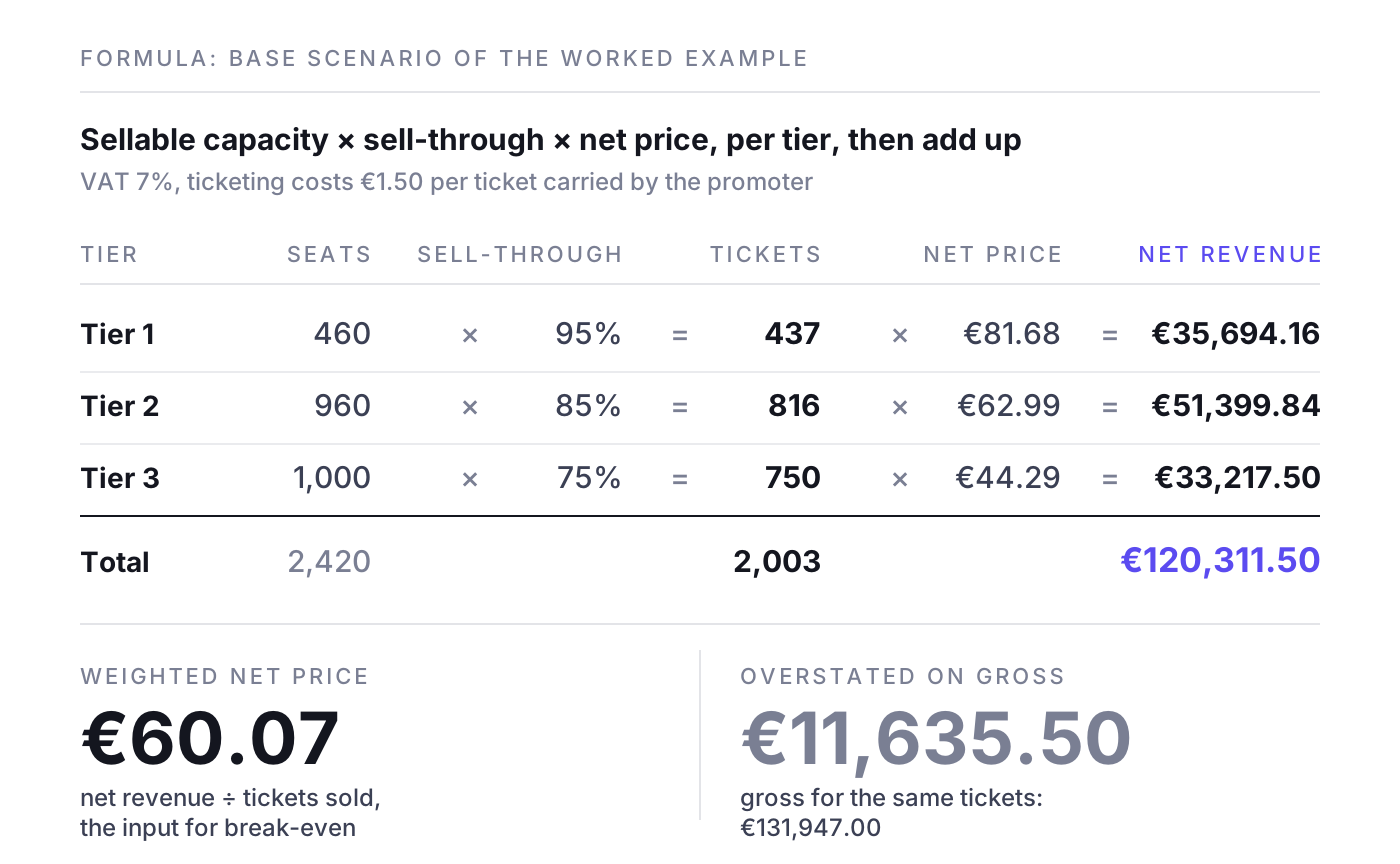
Net ticket revenue = Σ (sellable capacity × expected sell-through × net price) across all price tiers
1. Sellable capacity per tier
Do not start with venue capacity. Start with what actually goes on sale. Subtract production kills for the mixing desk and camera positions, restricted-view seats, artist and guest holds, and sponsor allocations. That number per tier is your ceiling.
2. Net price per ticket
Work the gross price down to what the promoter keeps:
- Gross price divided by (1 + VAT rate). Check the rate for your event with your accountant; it is not the same for every format or country.
- Minus ticketing costs per ticket that the promoter carries (system fee, payment processing, fulfilment).
- Booking fees kept by the ticketing company never belong in your revenue.
- Discounts, group rates and early bird prices go in as their own price level, not hidden in an average.
3. Expected sell-through per tier
This is the forecast proper, and the most uncertain number. Derive it from comparable shows: the same artist in other cities, similar artists in the same venue, earlier dates of the same production. Write down where each assumption comes from. As a rule of thumb, the best and the cheapest tiers sell first, and mid-priced seats at the sides of the room are the hardest to move.
4. Total and average price
Multiply per tier, add the results up and calculate the weighted average net price (net revenue divided by tickets sold). You need this value for break-even.
Ancillary revenue on its own line
F&B share, merchandise, parking, cloakroom or VIP upgrades can matter. Even so, keep them separate from ticket revenue. They depend on late contracts and fluctuate more than ticket sales. Mixing them into the core forecast is how a weak show gets made to look fine.
How to forecast ticket sales during the on-sale: comparables and the sales curve
Your first revenue forecast is made before the on-sale. From the first day of sales you have something better than assumptions: real sales. From then on the forecast should be a projection from actuals, not a static plan number.
Here is how:
- Build comparison curves: for three to five comparable shows, record what share of final sales had been reached at each point before the show, for example 12, 10, 8, 6, 4 and 2 weeks out.
- Capture actuals: every week, on the same weekday, pull tickets sold per tier from the ticketing system, not from the ad platforms.
- Project: projected final sales = current sales divided by the typical share at this point. Use the range of your comparables, not just the average.
- Assess the gap: if the projection is below the base scenario, that is a signal for marketing, pricing or capacity, not a reason to quietly adjust the assumptions.
The first days carry the most information. How to read where a show is heading from the first 72 hours is covered in the on-sale curve in the first 72 hours. And why this kind of demand forecast works differently from e-commerce is explained in forecasting ticket demand.
One caveat: a price increase, an added date, press coverage or a big campaign will shift the curve. Note such events in your sheet so you can explain jumps later.
Three scenarios and the break-even point
Conservative, base, optimistic
A single number implies a precision that does not exist before the on-sale. Work with three scenarios that differ only in sell-through per tier:
- Conservative: the show performs like the weakest of your comparables. This scenario shows your downside risk.
- Base: the show performs like the average of your comparables. This is the basis for budget and staffing.
- Optimistic: the show performs like the strongest comparable. Here you check when an extra date or higher prices would make sense.
Avoid an optimistic scenario with 100% in every tier. That is not a scenario; it is the capacity limit.
How to calculate break-even
The break-even point of an event is the number of tickets at which net revenue covers costs:
Break-even tickets = fixed costs / (weighted net price per ticket minus variable cost per ticket)
Fixed costs include the guarantee or artist fee, venue hire, production, staffing, insurance and the planned marketing budget. Variable costs are anything incurred per ticket sold that is not already in the net price, such as percentage-based royalties. If the deal gives the artist a share above a certain point, model that share as an additional cost above that point.
Break-even moves with the tier mix, because cheap seats pull the average down. Express it as a share of sellable capacity. A break-even at 69% is a different level of risk from one at 90%.
Worked example: a revenue forecast for a 2,500-capacity concert
Example with fictional numbers. VAT in the example is 7% (the reduced German rate that applies to many concerts; use your own rate), ticketing costs carried by the promoter are €1.50 per ticket.
Setup: a seated concert, one date, 2,500 seats in three tiers. After 80 kills and holds, 2,420 seats are sellable.
- Tier 1: 460 sellable seats, €89.00 gross, net price 89.00 / 1.07 = €83.18 minus €1.50 = €81.68
- Tier 2: 960 sellable seats, €69.00 gross, net price €62.99
- Tier 3: 1,000 sellable seats, €49.00 gross, net price €44.29
Base scenario (sell-through 95% / 85% / 75%):
- Tier 1: 437 tickets × €81.68 = €35,694.16
- Tier 2: 816 tickets × €62.99 = €51,399.84
- Tier 3: 750 tickets × €44.29 = €33,217.50
- Total: 2,003 tickets, net revenue €120,311.50, weighted net price €60.07
For comparison: gross revenue for the same 2,003 tickets is €131,947.00. Plan on that number and you overestimate the money available by €11,635.50.
Costs: artist fee €50,000, venue including staff €22,000, production €12,000, marketing €11,000, other (insurance, security, catering) €5,000. Total fixed costs: €100,000.
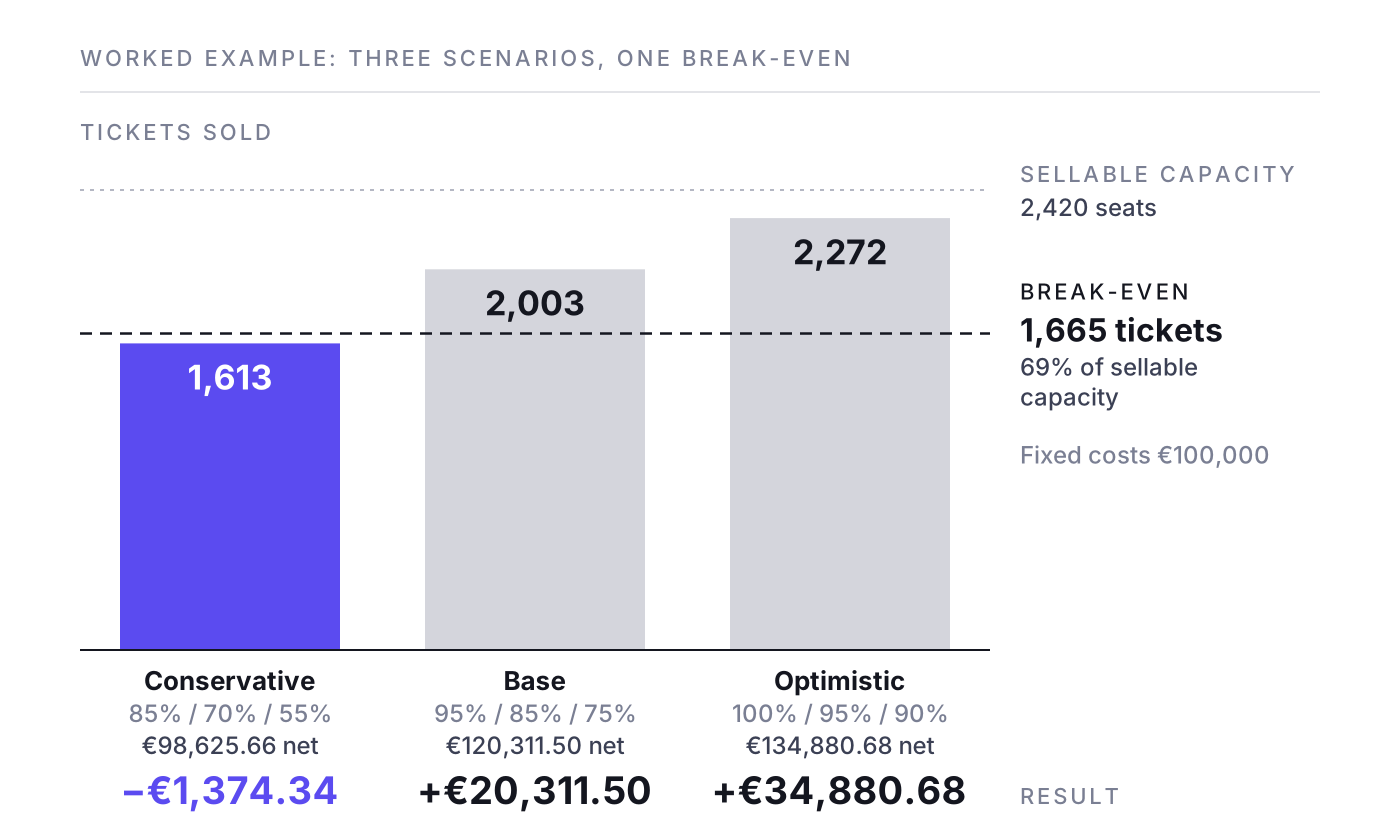
Break-even: €100,000 / €60.07 = 1,665 tickets, which is 69% of sellable capacity.
The three scenarios:
- Conservative (85% / 70% / 55%): 1,613 tickets, net revenue €98,625.66, result minus €1,374.34
- Base (95% / 85% / 75%): 2,003 tickets, net revenue €120,311.50, result plus €20,311.50
- Optimistic (100% / 95% / 90%): 2,272 tickets, net revenue €134,880.68, result plus €34,880.68
Solid in the base case, slightly negative in the conservative case. That is clear input for the negotiation: lower fixed costs, shift risk through the deal, or plan activity that sells more Tier 3 seats.
Updating during the on-sale: ten weeks before the show, 1,050 tickets have been sold. Your comparables had reached 50 to 60% of their final sales at this point, 55% on average. The projection is 1,050 / 0.55 = 1,909 tickets, with a range of 1,750 to 2,100. At the weighted net price that is about €114,700 in net revenue, roughly €14,700 above break-even but below the base scenario. No need for alarm, but the weaker tiers need targeted support.
Ancillary revenue: an F&B share of €3.00 per attendee would add about €6,000 in the base case. That line stays separate and does not count toward break-even.
How to turn these numbers into a verdict on the marketing budget after the show is covered in event ROI.
Template: the columns to rebuild in Excel
Sheet 1, one row per price tier and date:
- Date and venue
- Price tier
- Capacity per seating plan
- Kills and holds
- Sellable capacity (column 3 minus column 4)
- Gross price
- VAT rate
- Ticketing cost per ticket
- Net price (gross / (1 + VAT) minus ticketing cost)
- Sell-through conservative, base, optimistic (three columns)
- Tickets per scenario (three columns, sellable capacity × sell-through)
- Net revenue per scenario (three columns)
- Actual sales at cut-off date
- Share of final sales per comparison curve at cut-off date
- Projected final sales (actual sales / share)
- Gap to base scenario in tickets and percent
- Notes (price change, campaign launch, press)
Sheet 2: fixed costs, variable cost per ticket, weighted net price, break-even (tickets and % of sellable capacity), result per scenario. Sheet 3: ancillary revenue. Sheet 4: comparison curves by weeks out.
Common event revenue forecasting mistakes
- Forecasting on gross prices: VAT and ticketing costs are missing, so the forecast looks better than the show really is.
- Venue capacity instead of sellable capacity: kills and holds inflate the ceiling.
- One average price for all tiers: when cheap seats go first, the real average drops and break-even rises.
- Only one number: without a conservative scenario you only see your risk when it hits.
- Never updating the forecast: the plan number from announce day stays in the sheet until doors, even though the sales curve has long since told a different story.
- Platform data instead of ticketing data: ad platforms report purchases they credit to themselves. The truth is in the ticketing system.
- Counting ancillary revenue to reach break-even: if the show only works with bar sales, it does not work.
When the projection runs well above the base scenario, the forecast is also a pricing signal. How to turn demand into pricing decisions is covered in dynamic pricing as a demand signal.
Where NYBA fits
Everything above works in a spreadsheet. It gets heavy once you run many shows and dates at once: maintaining curves, pulling ticketing data weekly, projecting, and turning the results into budget decisions.
NYBA OS is the Revenue OS for live entertainment. It forecasts ticket demand per show, runs campaigns on every channel that sells tickets (Meta, Google, TikTok and other paid channels), shifts budget toward the shows that need it, and measures everything against verified ticket sales from the ticketing system rather than platform-reported purchases. It is built on experience from 75M+ tickets, 1,200+ events per year and 100+ promoters, including Live Nation, Cirque du Soleil and BBC Earth. The expert layer works on top of the platform, not instead of it.
Frequently asked questions
How do I make a revenue forecast for an event?
Determine sellable capacity and net price per price tier, estimate sell-through from comparable shows and multiply. Run three scenarios and update the forecast weekly with real sales.
How do I calculate net ticket revenue?
Gross price divided by (1 + VAT rate), minus the ticketing costs per ticket that you carry as the promoter. Booking fees kept by the ticketing company are not your revenue.
What is a good break-even point for an event?
There is no universal number. As a rule of thumb, the lower your break-even as a share of sellable capacity, the more headroom you have. What matters is whether the conservative scenario still reaches it.
How often should I update the ticket revenue forecast?
Weekly, on the same weekday. Check daily right after the on-sale and in the final two weeks.
What if I have no comparable data?
Use the closest proxy (same artist elsewhere, similar artists in the same venue, similar price range). Start with wide scenarios and narrow them once the first days of sales are in.
The method above works in a spreadsheet. If you want it running automatically per show and per date, book a demo. One event, clean numbers, then you decide.
Related reading: ticket sales KPIs, low ticket sales: what to do, marginal cost per incremental ticket, mid-week dates in multi-date runs

Was würde 3x mehr
Umsatz für dich bedeuten?
Finde es heraus:
